Contents:
- Image Loading
- Tab Docking
- Coordinate definition (Seedpoint initialization): seed and tumor points
- Annotation of Regions of Interest (ROIs) & Drawing
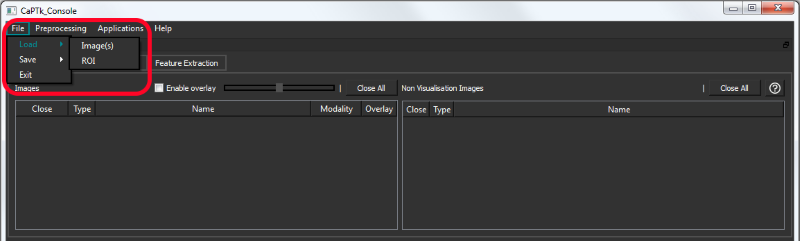
Image Loading
All the file types are loaded from the File -> Load menu.
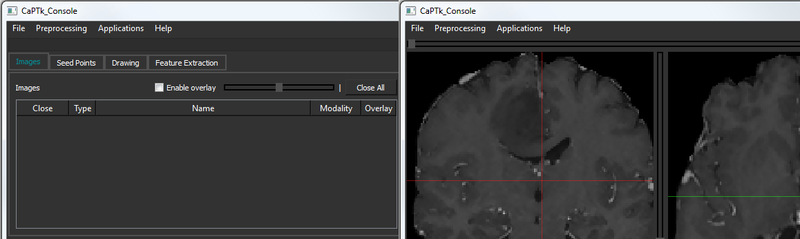
Various adjustments such as contrast/brightness (right mouse button click + horizontal/vertical drag on any visualization pane), window and level set (bottom panel) are available to the user. The bottom panel of CaPTk always shows basic information about the image and the currently selected coordinate.
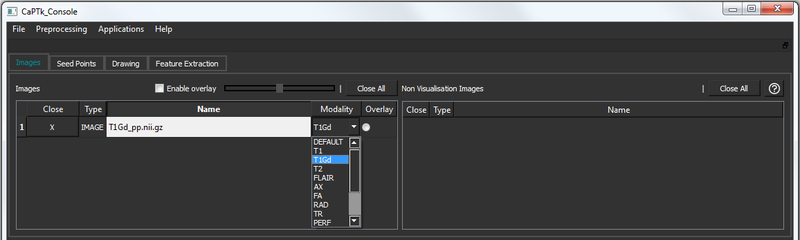
For every loaded image, the modality is automatically assigned using the file name (for NIfTI). In case of discrepancy, the user can use the drop-down modality switcher (see below) to change accordingly. This is needed for further using the images in the Specialized Analysis applications.
Tab Docking (Windows-only)
Double clicking on the tab bar will dock/undock the entire section. This behavior is replicated by single click of the dock/undock button at the end of the section as well.
Coordinate definition (Seed-point initialization)
The Seed Points tab includes two general types of initialization - tumor points and tissue points. The controls to add/remove points are the same as above. The radio buttons control which initialization type is selected and related functions.
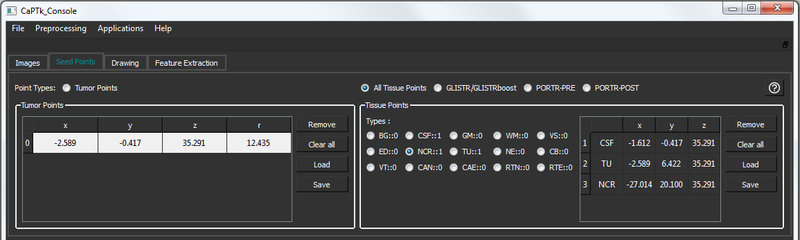
Tumor Points
These are seed-points used to approximate a tumor by a parametric spherical model, using a seed-point for its center and another for its radius. These are helpful for applications like tumor growth model simulation. The controls are as follows:
| Key Stroke | Function |
|---|---|
| Shift + Space | Set initial tumor center |
| Ctrl + Space | Update tumor radius |
| Space | Update tumor center |
Tissue Points
These are seed-points with coordinate information. They can be used for a multitude of applications where manual initialization(s) are required for a semi-automated algorithm, e.g, segmentation. There are various tissues that can be initialized in this panel:
| Tissue Acronym | Full Form |
|---|---|
| CSF | Cerebrospinal Fluid |
| VT | Ventricular Cerebrospinal Fluid |
| GM | Gray Matter |
| WM | White Matter |
| VS | Vessels |
| ED | Edema |
| NCR | Necrosis |
| TU | Enhancing Tumor |
| NE | Non-Enhancing Tumor |
| CB | Cerebellum |
| CAE | Enhancing Cavity |
| CAN | Non-Enhancing Cavity |
| RTN | Tumor Recurrence |
| RTE | Enhanced Tumor Recurrence |
Application-specific tissue types are automatically enabled when the corresponding application is selected. For example, when trying to initialize tissue points for GLISTR/GLISTRboost, only CSF, GM, WM, VS, ED, NCR, TU, NE and CB buttons will be enabled and the rest will be disabled. If there are some required tissue types missing for an application, CaPTk will display a warning and not let the user save the incorrect tissue points.
NOTE: Initial points (tumor center and tissue point) can be added using Double Click of the mouse.
Loading and saving is done via text files in a format consistent with similar applications. Seedpoint files are needed for the following applications (and all derivatives): GLISTR, GLISTRboost (BRATS 2015 top-ranked algorithm) and PORTR.
Annotation of Regions of Interest (ROIs)
ROIs are useful for applications that need a mask as input. There are the following controls underneath the Drawing tab:
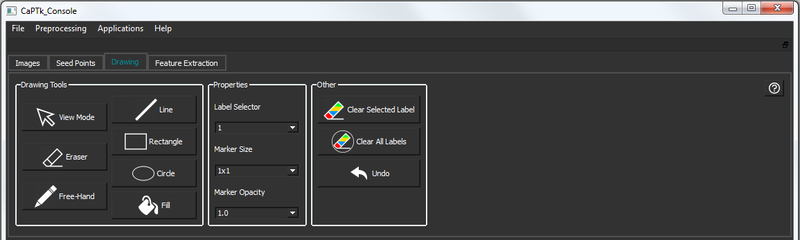
| Button/Box | Description |
|---|---|
| View Mode | Switch from drawing mode (which is enabled when either Near or Far ROI drawing is selected) to normal viewing mode |
| Line | Draw a line of selected label color and size |
| Rectangle | Draw a rectangle of selected label color and size |
| Circle | Draw a circle of selected label color and size |
| Free-Hand | Draw selected label using brush of specified size using mouse left button drag |
| Fill | Fill a closed boundary with selected label - uses ITK's connected component filter |
| Eraser | Erases all labels using brush of specified size |
| Label Selector | Label selector between 1-5 |
| Marker Size | A square marker of specific voxel size |
| Marker Opacity | Sets the opacity of the marker between 0.0 (transparent) - 1 (opaque) |
| Clear Selected Label | Remove selected label completely from the mask |
| Clear All Labels | Remove all labels completely from the mask |
| Undo | Undoes last drawing action |
- Generated on Tue Feb 6 2018 10:02:06 for Cancer Imaging Phenomics Toolkit (CaPTk) by
 1.8.14