Image Visualization
Sliders on each visualization panel (highlighted in green in the figure below) control the movement across respective axes.
Note that in DSC-MRI, the single horizontal slider (highlighted in yellow) moves across the time of the acquired dynamic scan.
Various adjustments are available to the user, including:
- contrast/brightness: right mouse button click + horizontal/vertical drag on any visualization panel, respectively.
- windowing of intensities and setting of different visualization type: bottom-right panel.
- zooming into the image via Ctrl + mouse wheel.
The bottom-left panel of CaPTk (highlighted in red) shows basic information about the image and the position of the cross-hair. In the visualization panes, the "Z" axis is the center; and "Y" and "X" are to its left and right, respectively. "Z" represents the Axial view for RAI-to-LPS images.
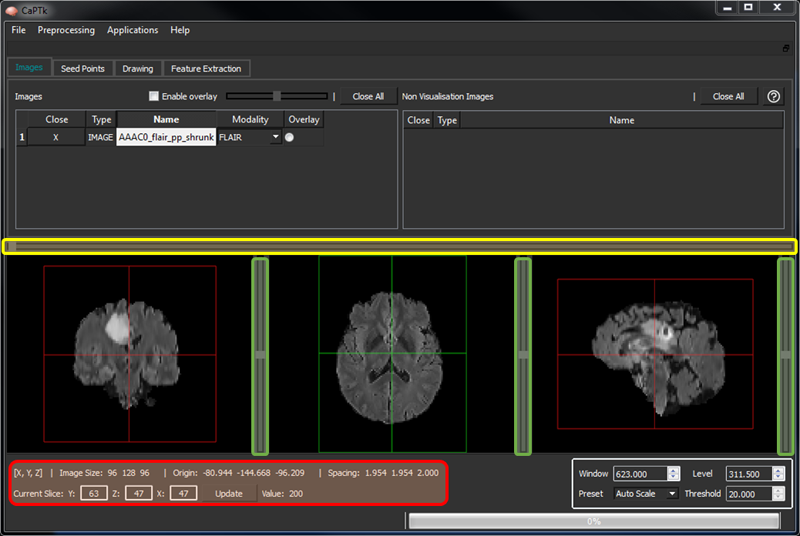
Visualization Sliders and Image Information
The "Overlay" functionality enables the visualization between two loaded images:
- Double-click one of the two images you want to visualize and then click on its corresponding "overlay" radio button, on its right-most column.
- Click on the "overlay" radio button of the second image that you want to visualize.
- Both "Overlay" and "Underlay" images are now visualized with 50% opacity.
- Check the tick box "Change Opacity".
- Moving the slider changes the opacity between the "Overlay" and the "Underlay" images.